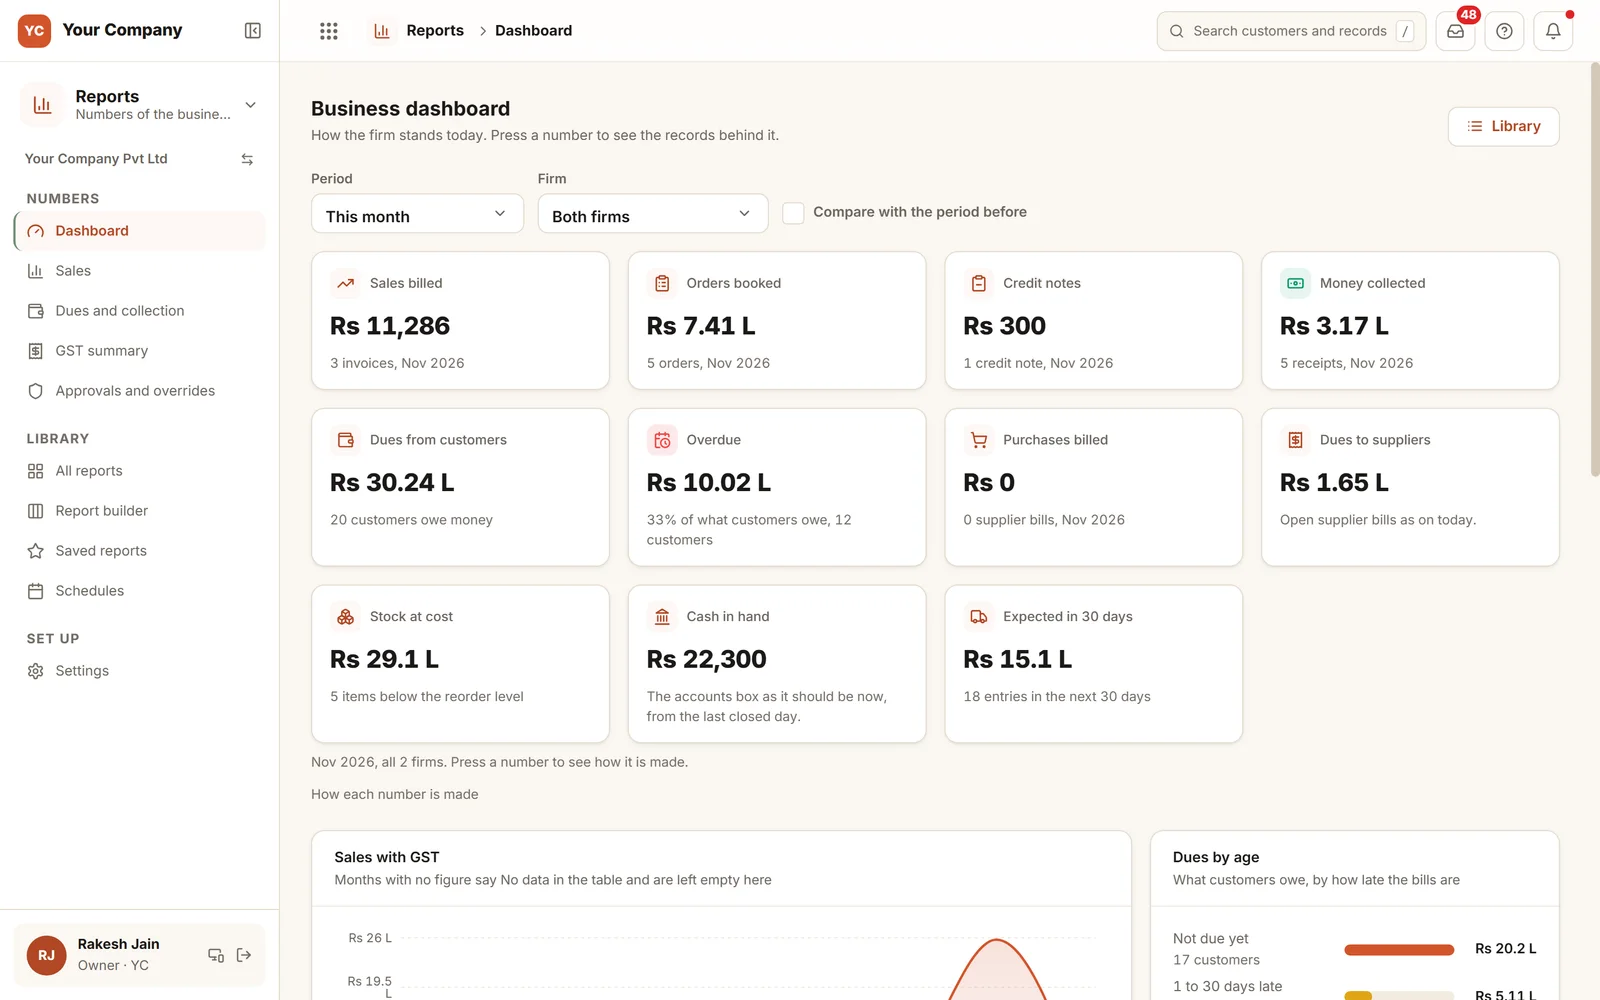
The whole business on one screen. Press a number, see its records.
Sales, money collected, dues, overdue, purchases, stock and cash sit together on one dashboard. Press any figure and the records behind it open. Each figure is read from the app that owns it, so nothing is typed a second time.
- Free 14-day trial
- No charge per user
- Any report as an Excel file
The numbers are there. They simply do not match.
Sales quotes one figure, accounts another, and the owner's sheet a third. By the time they are reconciled, the week has gone.
- 01The day's figures arrive by phoning three people, who each give a different one.
- 02A report is built by hand on Saturday from five Excel sheets, and is stale by Monday.
- 03The total at the foot does not agree with the rows above, and nobody knows which to trust.
- 04A salesperson receives a report listing every customer, not just their own.
- 05The accountant requests GST figures and receives a list that does not agree with the bills.
Four rules behind every figure.
A report never holds numbers of its own. It reads the app that owns them, shows Just what the reader is allowed to see, and opens the rows under each figure.
Rule 1 · Source
Taken from the owning app
- Sales come from Dispatch, dues from Payments, stock from Stock
- Each total is the sum of the rows beneath it
- Months before your first bill read No data, not zero
- The GST summary is built from the same rows as the return file
Rule 2 · Scope
Only what that reader is cleared for
- Every number follows the reader's role
- A salesperson sees only their own customers
- A shared report is made afresh for each reader
- Passing on a report never passes on the figures
Rule 3 · Open
Each number leads to its list
- Tap a figure and its records open
- The same rows come out in Excel
- Compare with the period before
- Save a report under a name, and star it
Rule 4 · On time
Figures arrive without a search
- The owner's Home each morning, with what changed
- An evening report at a time you pick, on working days
- A saved report sent by itself, daily, weekly or monthly
- Delivered to each person with their own access
Reports reads from the other apps. Sales and GST reports depend on Dispatch and Billing, dues on Payments, purchases on Purchase and stock on Stock. If you choose Reports with just two other apps, such reports remain blank.
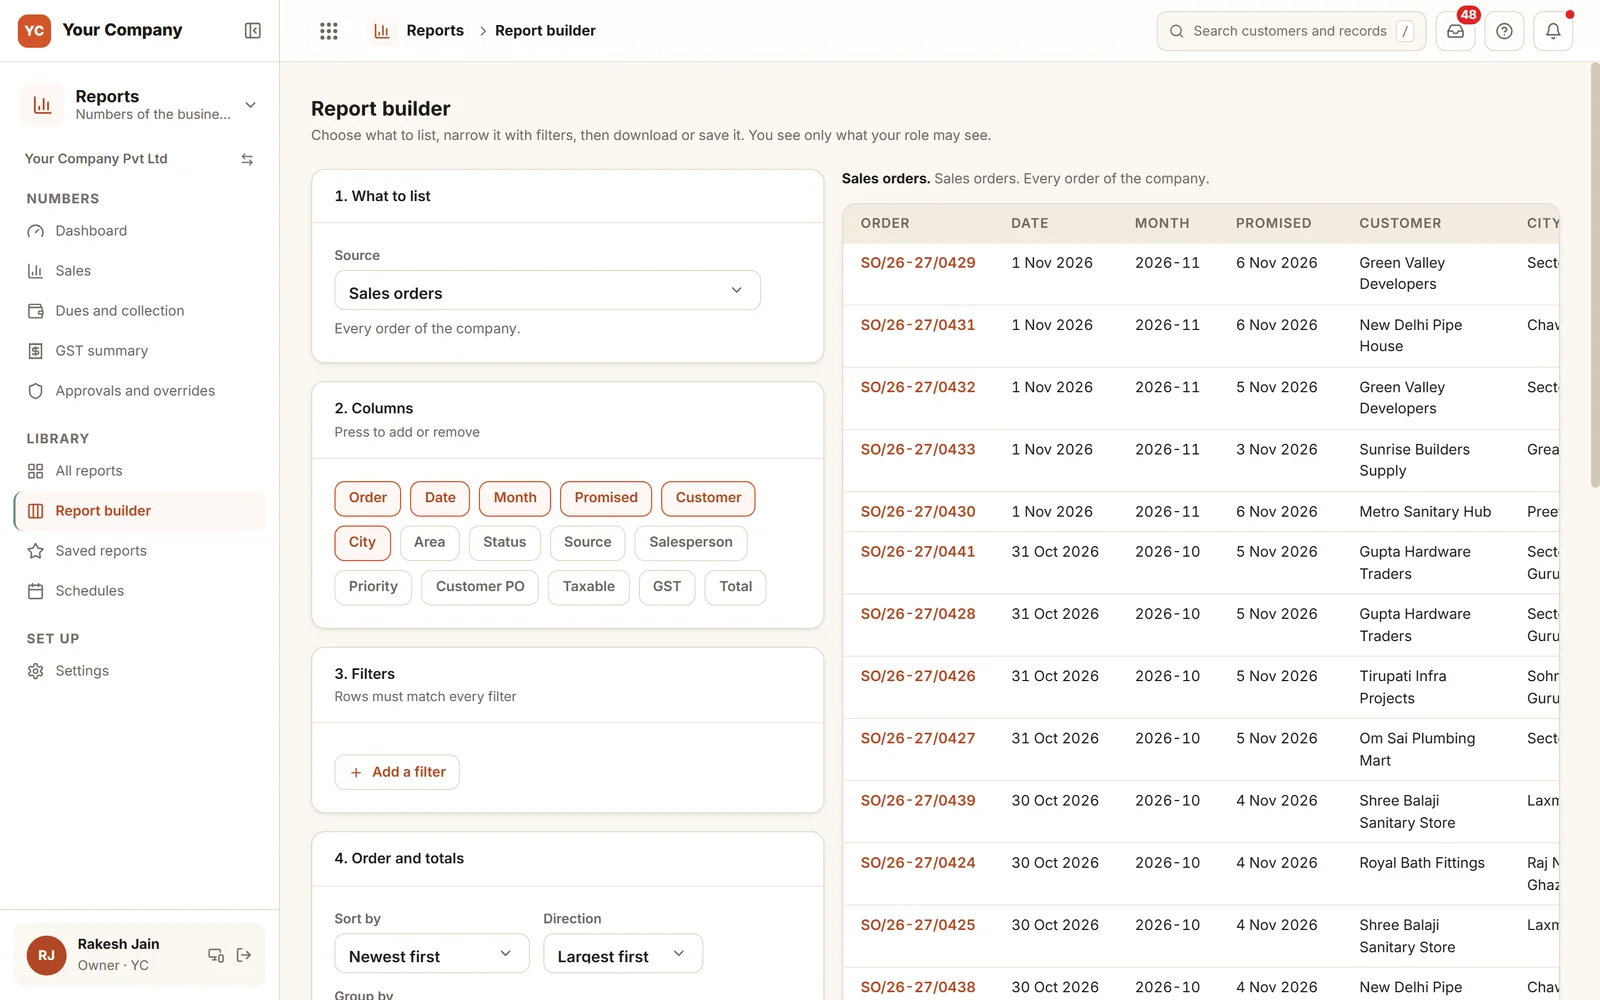
Design a report. See only what is yours to see.
Choose what to list, then the columns, filters and sort, and the rows show beside them. There is no free query: each source offers a fixed set of columns, and the rows obey the same rules as the source's own list. Someone limited to their own customers sees only those here as well.
Six reports opened every week by owners and accounts.
Real screens of the Business Suite, with sample data. Nothing here is a drawing.
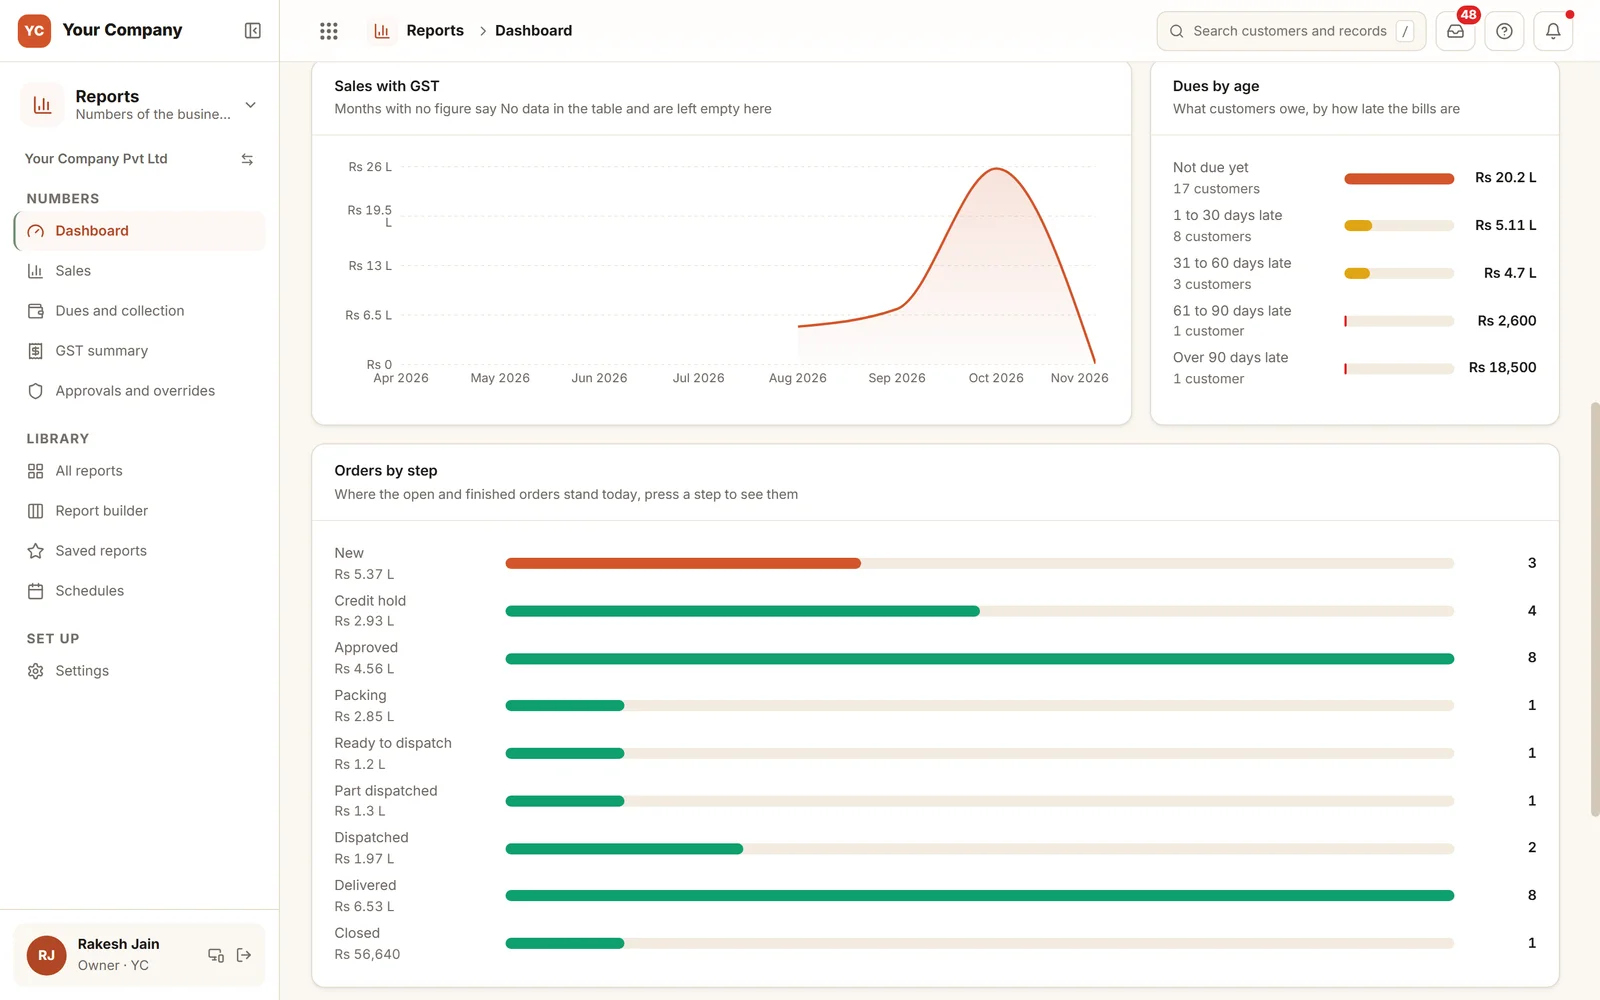
- 1Sales by monthA month with no figure stays empty and reads No data, never zero.
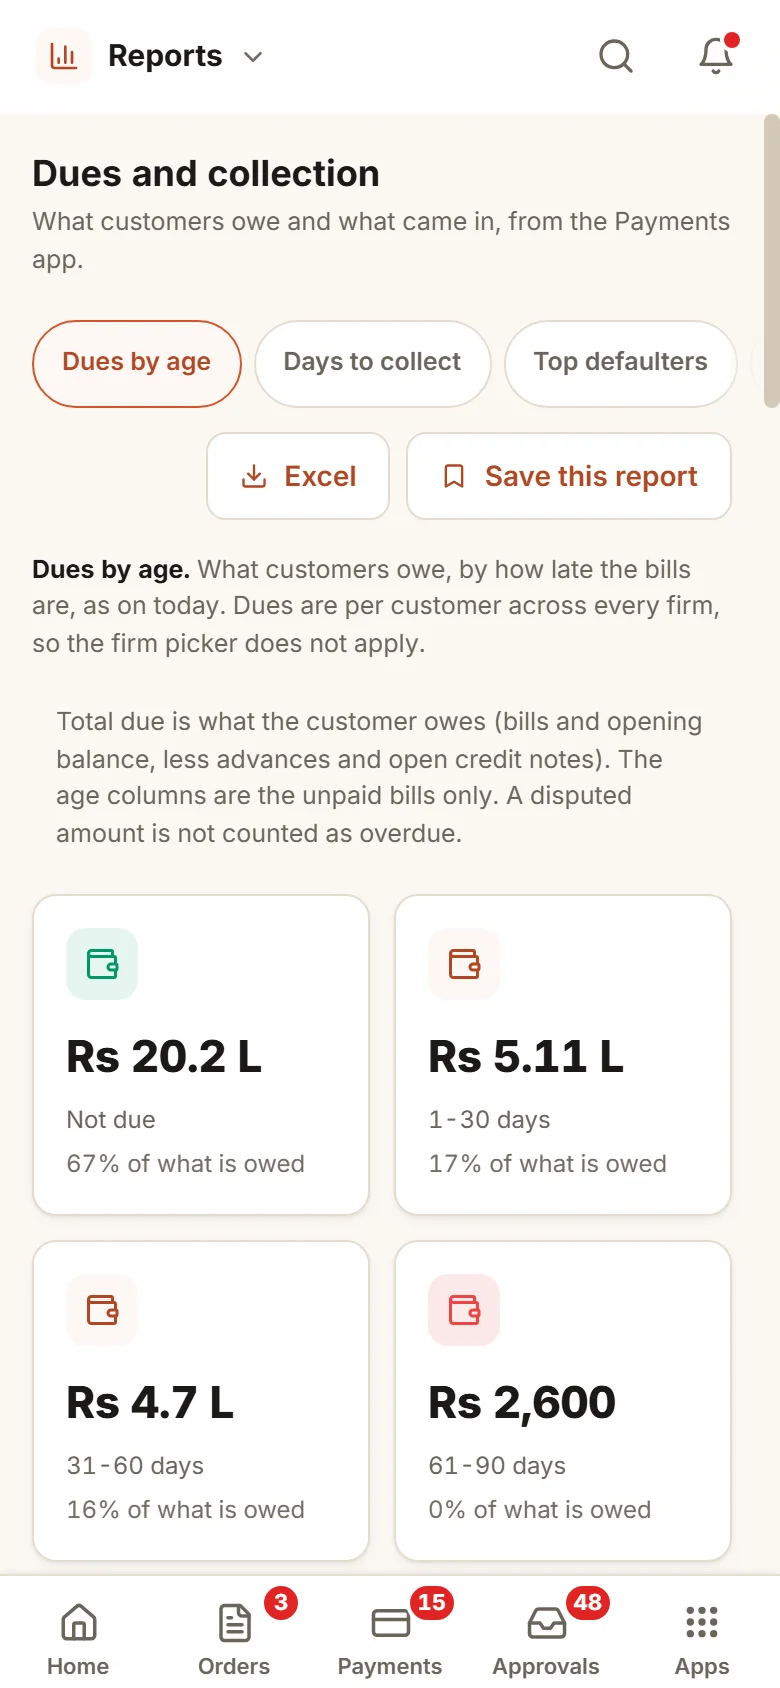
- 2Dues by ageWhat customers owe, split by how late the bills are, with the customer count.
- 3Orders by stepWhere open and finished orders stand now; press a step to see them.
One look for the owner. A working list for accounts.
- 9:00 am
The owner starts on the dashboard
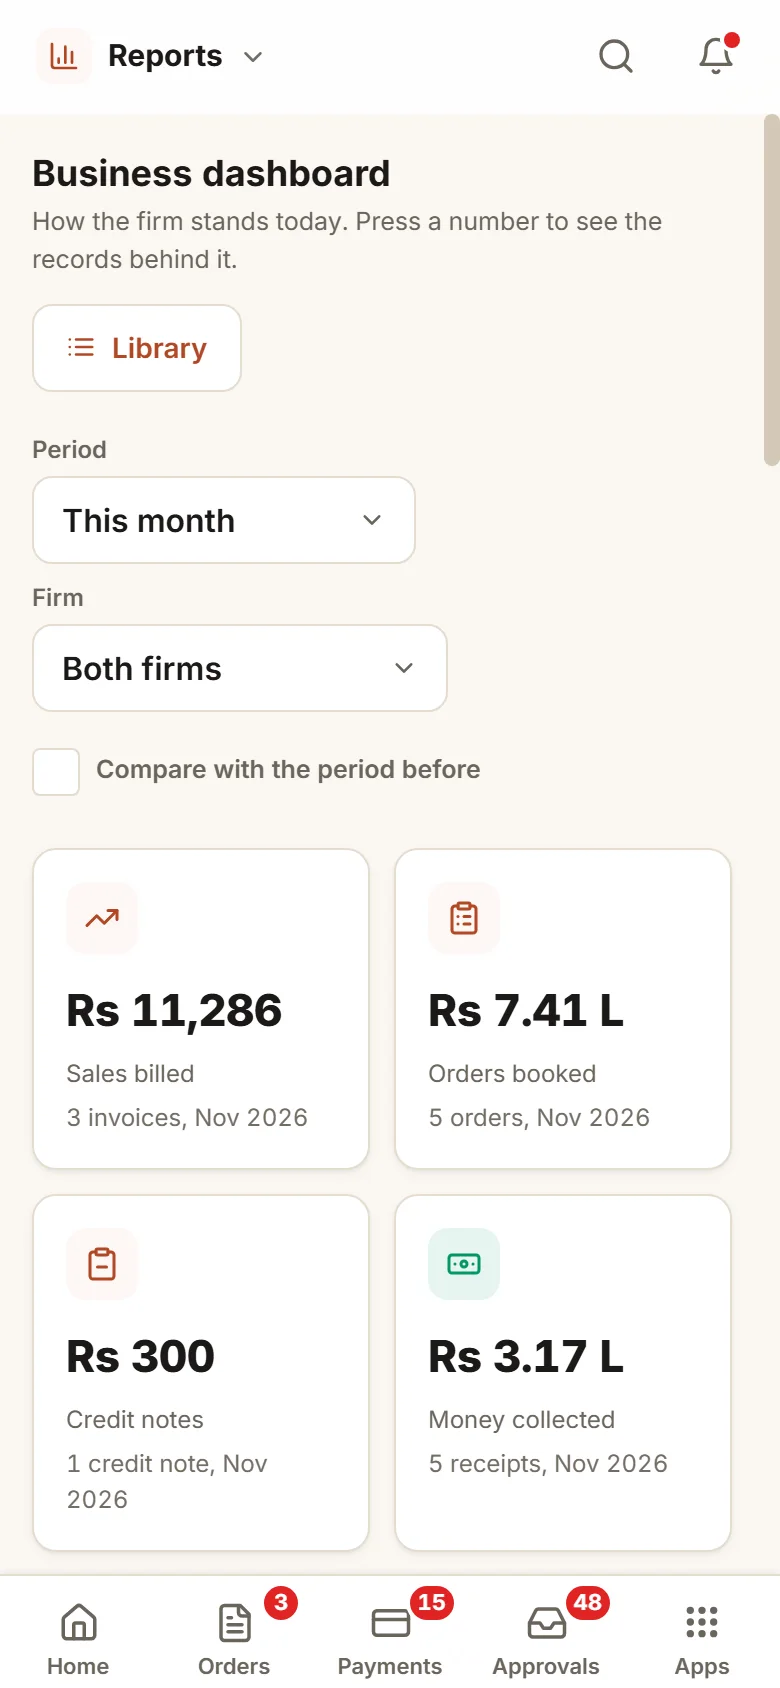
Sales, collections and overdue amounts, all on the phone. Every figure opens its own records.
- 11:00 am
Accounts takes the dues
Dues by age first, then customers more than 30 days late, with the same rows as Excel.
- Evening
The day's figures arrive
At the time you set, every person you chose receives the numbers of their own Home, by phone or mail.
You decide who sees which number.
Tied to the role, not to a link
A report gives each person the numbers their role may open. A salesperson limited to their own customers sees only those.
Share the report, not the figures
The owner passes a saved report to chosen roles. It is built again for each reader, using that reader's access.
Schedules
A saved report every day, week or month, at a set time, for the people you pick. Email leaves only from your own mailbox, once it is set up.
A Home in the order you choose
The owner picks which numbers come first on the Home of each role.
Overrides in plain sight
The approvals report shows what the owner did by hand that skipped a step, beside everyone else's decisions.
Excel for any report
Rows and totals identical to the ones on screen.
Who it is for
- Owners who begin the day by phoning three people for figures
- Manufacturers and distributors whose sales, dues and stock are kept by different people
- Accountants who need GST figures for the month taken from the bills
- Groups where one owner holds more than one firm
What it does not do
- It draws on the other apps: sales and GST rely on Dispatch and Billing, dues on Payments, stock on Stock.
- It never files a GST return. The summary is passed to your accountant.
- It is no replacement for accounting software. Your books stay in Tally or Busy.
One way in for every app of the Suite.
What owners ask before they start.
Where do the figures come from?
Each one is read from its owner: sales from Dispatch and Billing, dues from Payments, stock from Stock, purchases from Purchase. Reports holds no numbers of its own, so two screens never disagree.
Can a salesperson see the dues of every customer?
No. Every person sees whatever their role permits. A salesperson restricted to their own customers sees only those, in all reports and in the builder.
Does AI write the top line of the owner Home?
No. Every word of the top line and the cards comes from a rule. It only reads the numbers and never decides, moves or sends anything. Saathi has its own morning brief, off by default, which can be worded by AI only when you switch that on.
Can reports reach us without opening the app?
Yes. The evening report goes to each person chosen at the time you set. A saved report can be scheduled daily, weekly or monthly, and mailed as Excel once your mailbox is connected.
What is in the offer?
You start with a free 14-day trial. Then come a one-time setup on your own data and a monthly plan for running and care, with no charge per user. Reports reads the other apps, so sales and GST reports need Dispatch and Billing, dues need Payments, and stock needs Stock. See the pricing section of this page for the terms.
Where does our data live?
On our servers. Any report can be exported to Excel whenever you ask.
Open your own business on a single screen, each number with its list.
Try it first. Decide after. Fourteen days free with sample data, set up for you the same working day.